


IP.com® combines ideation, problem-solving, intellectual property & patent intelligence software with comprehensive services, which accelerates clients’ innovation workflows. Our solutions deliver competitive insights and powerful data analytics, enabling inventors, engineers, R&D teams, and IP professionals to make informed IP decisions. We’re dedicated to making our customers’ innovation processes easier, faster, and better. We power the innovation that powers the world!
Industries & Use Cases
Innovation is critical to organizational survival. It is complex and requires precious time, money, and resources. Entities across all industries must be agile to quickly and cost-effectively move innovations and intellectual property forward. IP.com is an innovation acceleration company that provides end-to-end AI-driven workflow solutions and professional services powered by our Semantic Gist® engine. Our offerings provide a single, trusted source of support for anyone looking to conceive, validate, evaluate, protect, target, and monetize the highest-potential ideas, innovation, and IP in the fastest and most cost-effective way across many different industries and users.
I can’t imagine being able to manage a large patent portfolio and to get the results we have enjoyed without features like semantic search and HD-Analyze in InnovationQ+. It’s like having a dedicated AI assistant.
Brands that Trust IP.com
Welcome to IP.com®, a pioneering force in transforming intellectual property management. Our company’s origins date back to 1994 with the creation of our natural language processing engine, Semantic Gist™. Anchoring our mission was a bold aspiration: streamlining research and development evaluation to empower organizations through rapid intellectual property assessment and expedited innovation processes


IP.COM Overview

We Power the Innovation that Powers the World’s Intellectual Property
Innovation is critical to organizational survival. It is complex, and requires precious time, money and resources. Entities must be agile in order to quickly and cost-effectively move innovations forward.
The IP.com Innovation Power Suite offers end-to-end workflow solutions, complemented by professional services, which enables infinite innovation potential powered by our Semantic Gist® engine. Our offerings provide a single, trusted source of support for anyone looking to conceive, validate, evaluate, protect, target and monetize the highest-potential ideas, innovation and intellectual property in the fastest and most cost-effective way. We give entities everything they need to save time, lower costs and make every decision with the highest confidence.
IP Suite: Products

IQ Ideas+™ is unique in the market, filling a gap that traditional problem-solving tools and methodologies fail to address. It helps innovators and engineers generate and refine ideas with the greatest potential at the source of the process—before precious time and resources are wasted—so you can accelerate ROI.

InnovationQ+ is an innovation and IP decision support workflow solution packed with powerful data analytics and competitive insights that enable informed, rapid decisions—reducing costs, maximizing ROI, and accelerating innovation. Our patent search software and analytics platform improves ROI across the entire innovation lifecycle, from ideation to monetization.
Prior Art Database, the first and largest online prior art disclosure service, provides technical disclosures to patent offices around the world. Safeguard your Freedom to Operate by publishing technical disclosures to the Prior Art Database, making them available instantly.
IP Suite: Analytics
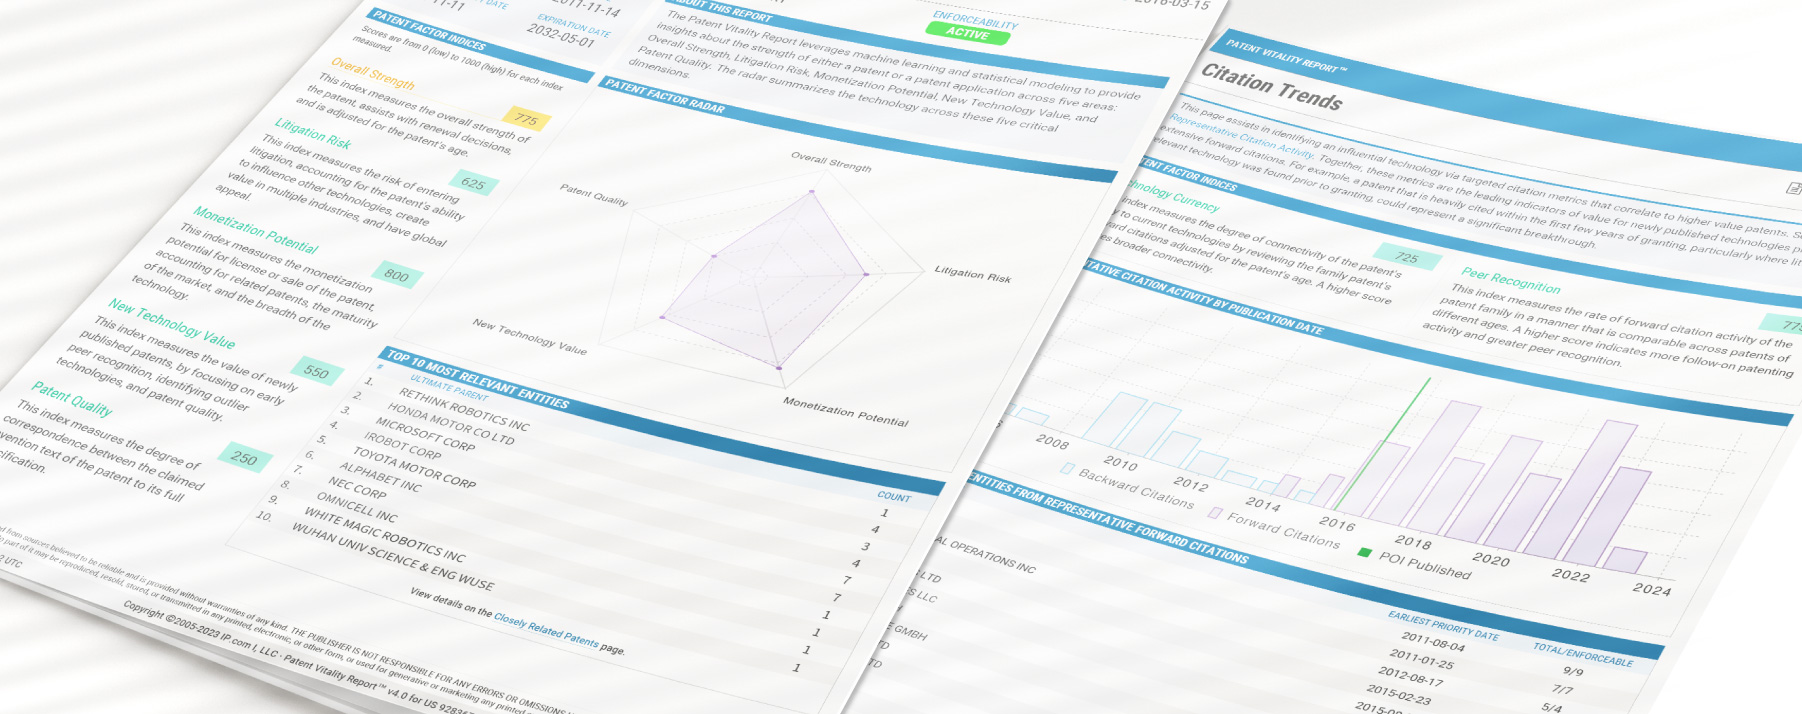
Patent Vitality Report
The Patent Vitality Report (PVR) gives patent owners, buyers, and sellers an objective analysis of the assets in a patent portfolio. It provides valuable patent analysis in five understandable scores: overall strength, litigation risk, monetization potential, new technology value, and patent quality.
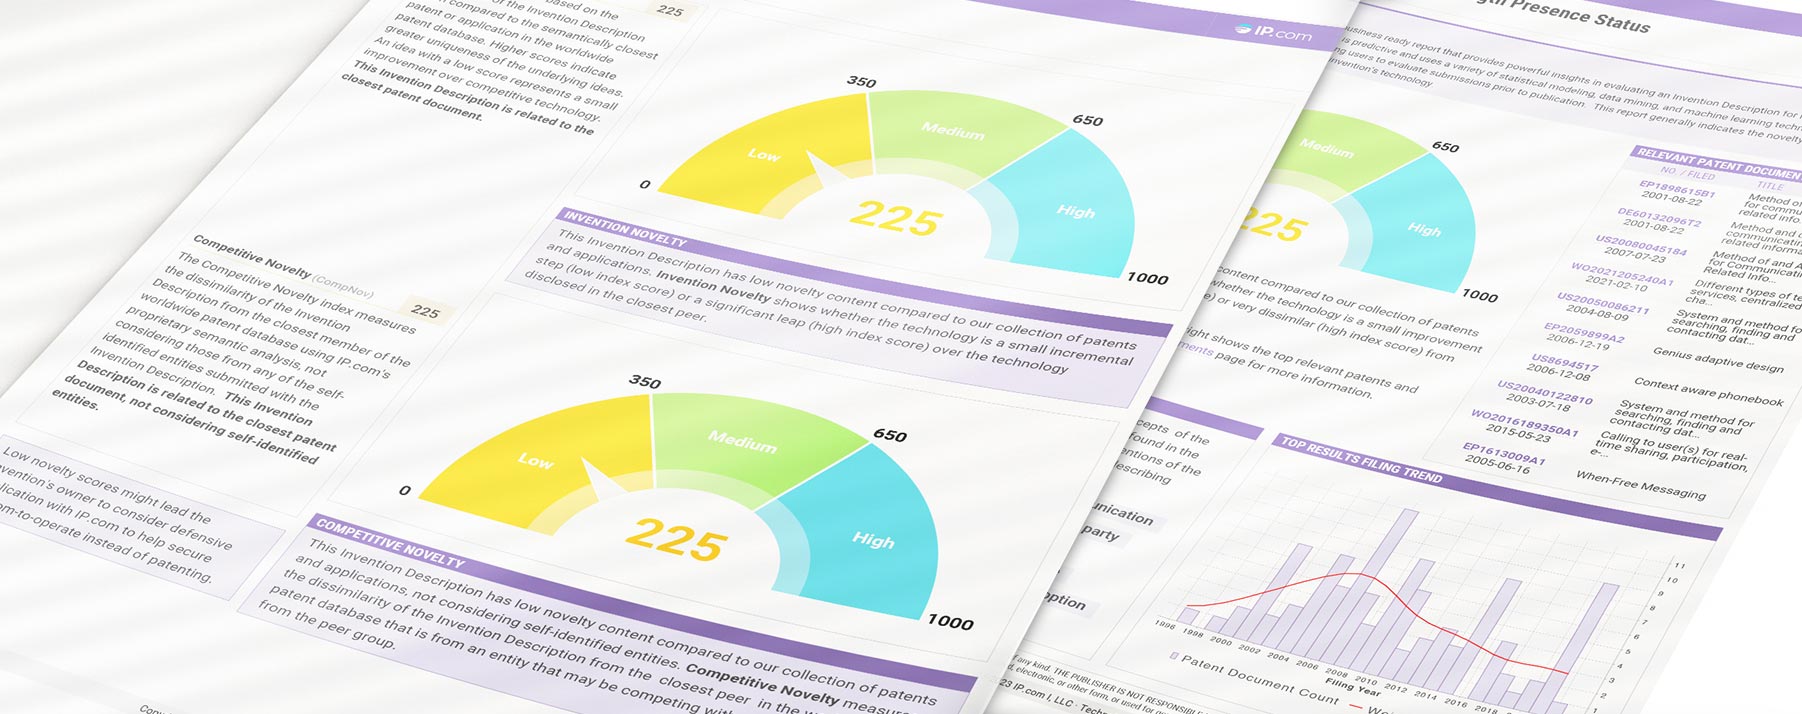
Technology VITALITY REPORT
Our Technology Vitality Report uses a proprietary AI engine to power comprehensive IP evaluation, allowing you to rank ideas in a fast, efficient, and transparent way. Get fast and thorough decisions with our Technology Vitality Report (TVR) and improve your review process with less effort.
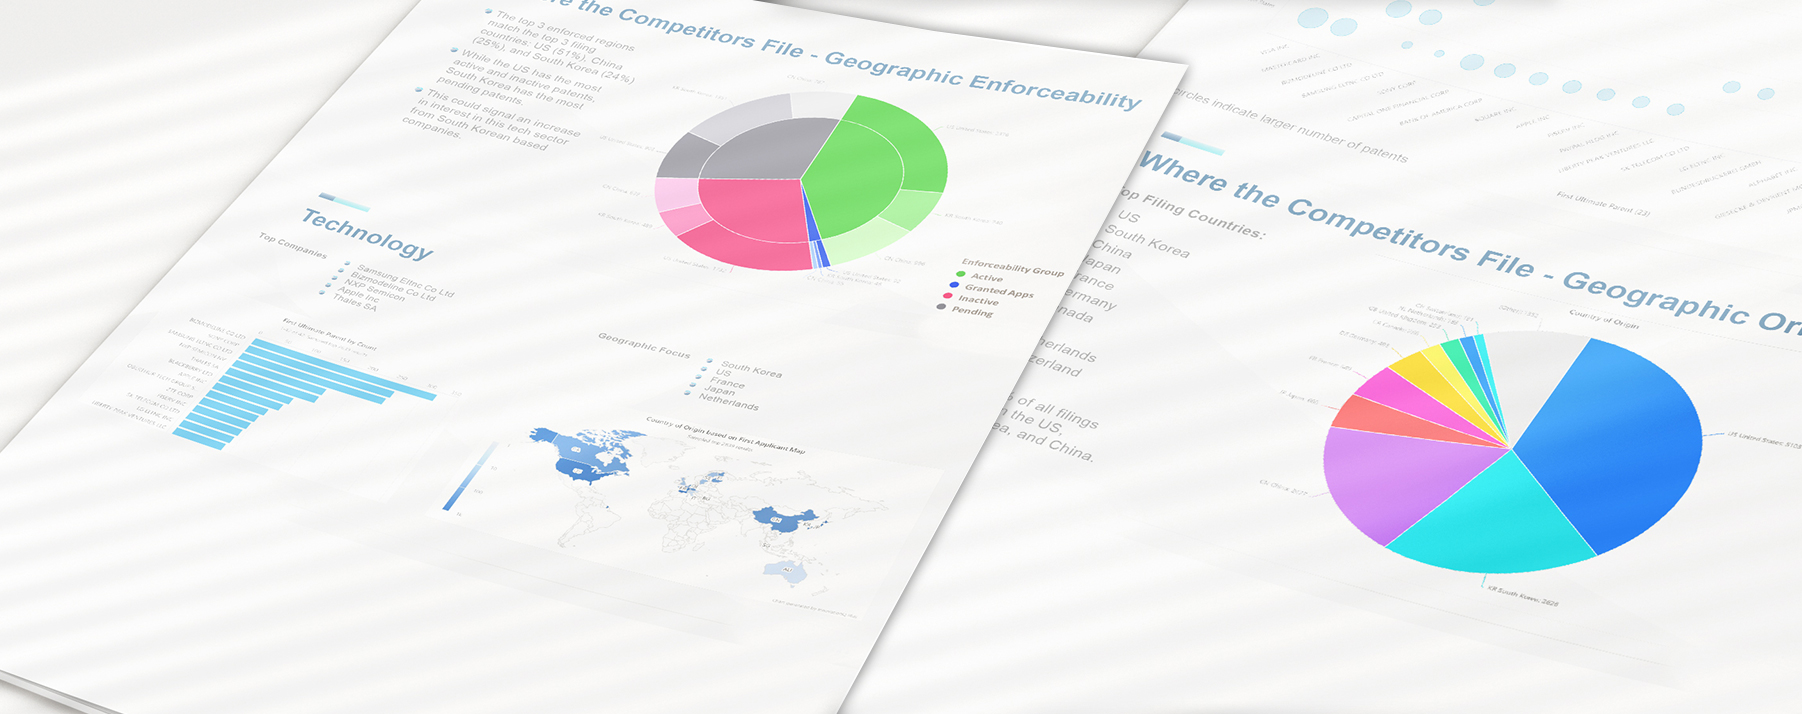
Portfolio Intelligence Report
Assess your patent portfolio value and stay ahead of competitors while optimizing your IP strategy with customized innovation intelligence delivered by our Portfolio Intelligence Report. Our Portfolio Intelligence Report (PIR) can help you quickly rank and understand portfolios of patented and patent-pending technologies.
IP Suite: Services

ACCELERATE RESULTS WITH A TRUSTED INNOVATION PARTNER:
Bring your innovations to market faster! Position your research and development team to increase internal efficiency, reduce outsourcing costs, and improve patentability with solutions from IP.com. Rapid innovation requires rapid intelligence. Our world-class Professional Services team speeds up your innovation workflows, completing essential research, analytics, editing, and reporting tasks using industry-leading expertise and our AI-driven solutions.
Entrust
Our team of highly-qualified, US-based, and ITAR-compliant subject matter experts provide the industry depth and expertise you need with certainty and confidentiality.
Envision
We help you understand threats and opportunities to prioritize R&D, spend better, and achieve your innovation potential.
Empower
We surface and organize the most relevant, actionable data to propel your business to more substantial IP and better bottom-line results.
Patent & IP News

The Importance of the National Artificial Intelligence Research Resource (NAIRR) Pilot to Public Research
The collaborative nature of the NIARR pilot, bringing together academia, industry, nonprofit and government sectors, is intended to promote cross-sector partnerships. Industry collaboration can lead to the development of commercially viable AI applications and solutions, fostering economic growth by creating new markets and revenue streams.

Join IP.com at Booth #111 for Exclusive AI Innovations at FLC National Meeting 2024
IP.com is sponsoring the FLC National Meeting 2024. Join us on April 9-11 for key insights on federal tech transfer. Don’t miss our presentation on Generative AI for Structured Ideation and preview our AI-powered IP solutions!

The Palworld Phenomenon and Copyright Infringement in the Viral, Fast-Paced Gaming Industry
During Palworld’s massive launch, more and more players and spectators online began to throw some hefty accusations at Pocketpair. While the Pokémon comparison is clear, some have called into question both how Pals were created, claiming the use of A.I., and how similar some are to Game Freak’s own Pokémon designs. Neither Nintendo, Game Freak, nor The Pokémon Company have commented on Palworld and its Pal design similarities to Pokémon.